Notes on the Growth of Harpenden
From 1851 to 1975


To see the update prepared in 2002 please click here
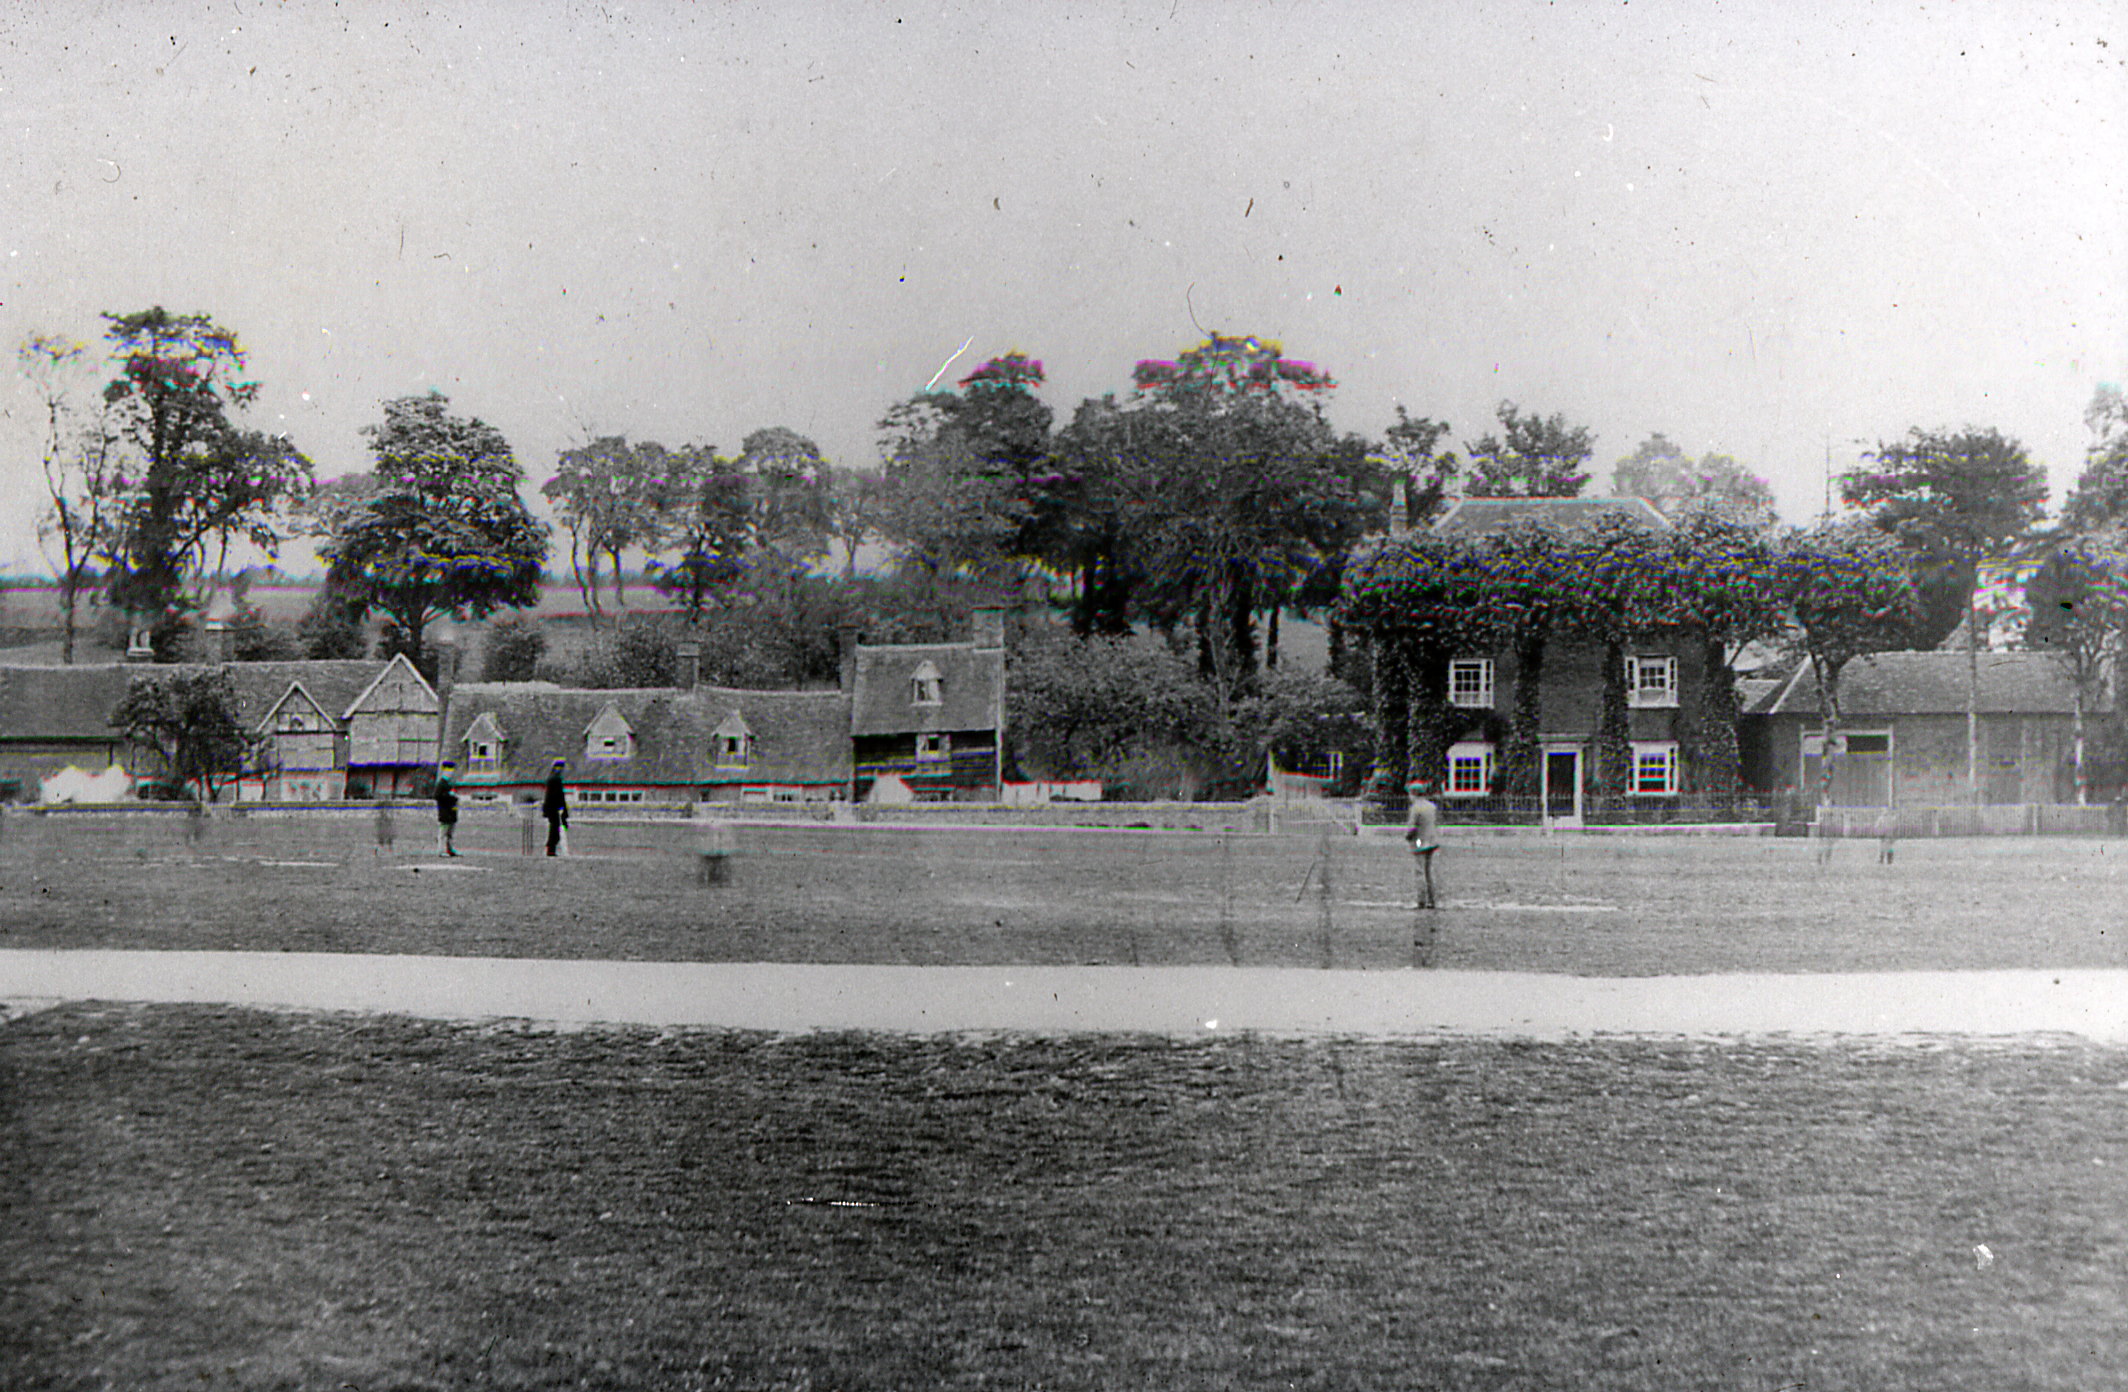
Before the coming of the railways, Harpenden was a small, mainly agricultural village, with a population in 1851 of 1980 people living in 418 houses. The houses were mainly grouped around the centre of the village (the present shopping area) with small hamlets at Bowling Alley (now Southdown), Batford, the Old Bell area, Kinsbourne Green and Hatching Green.
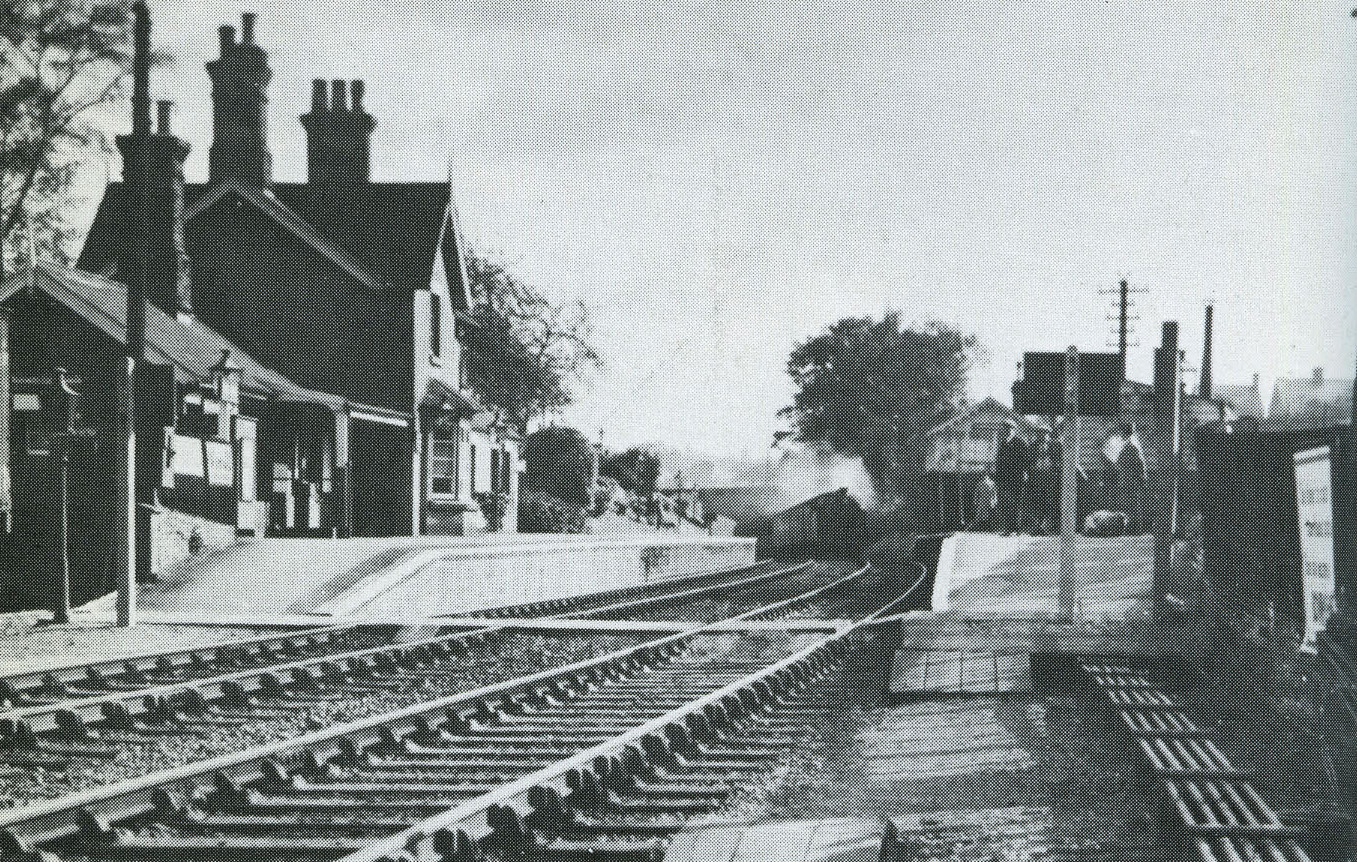
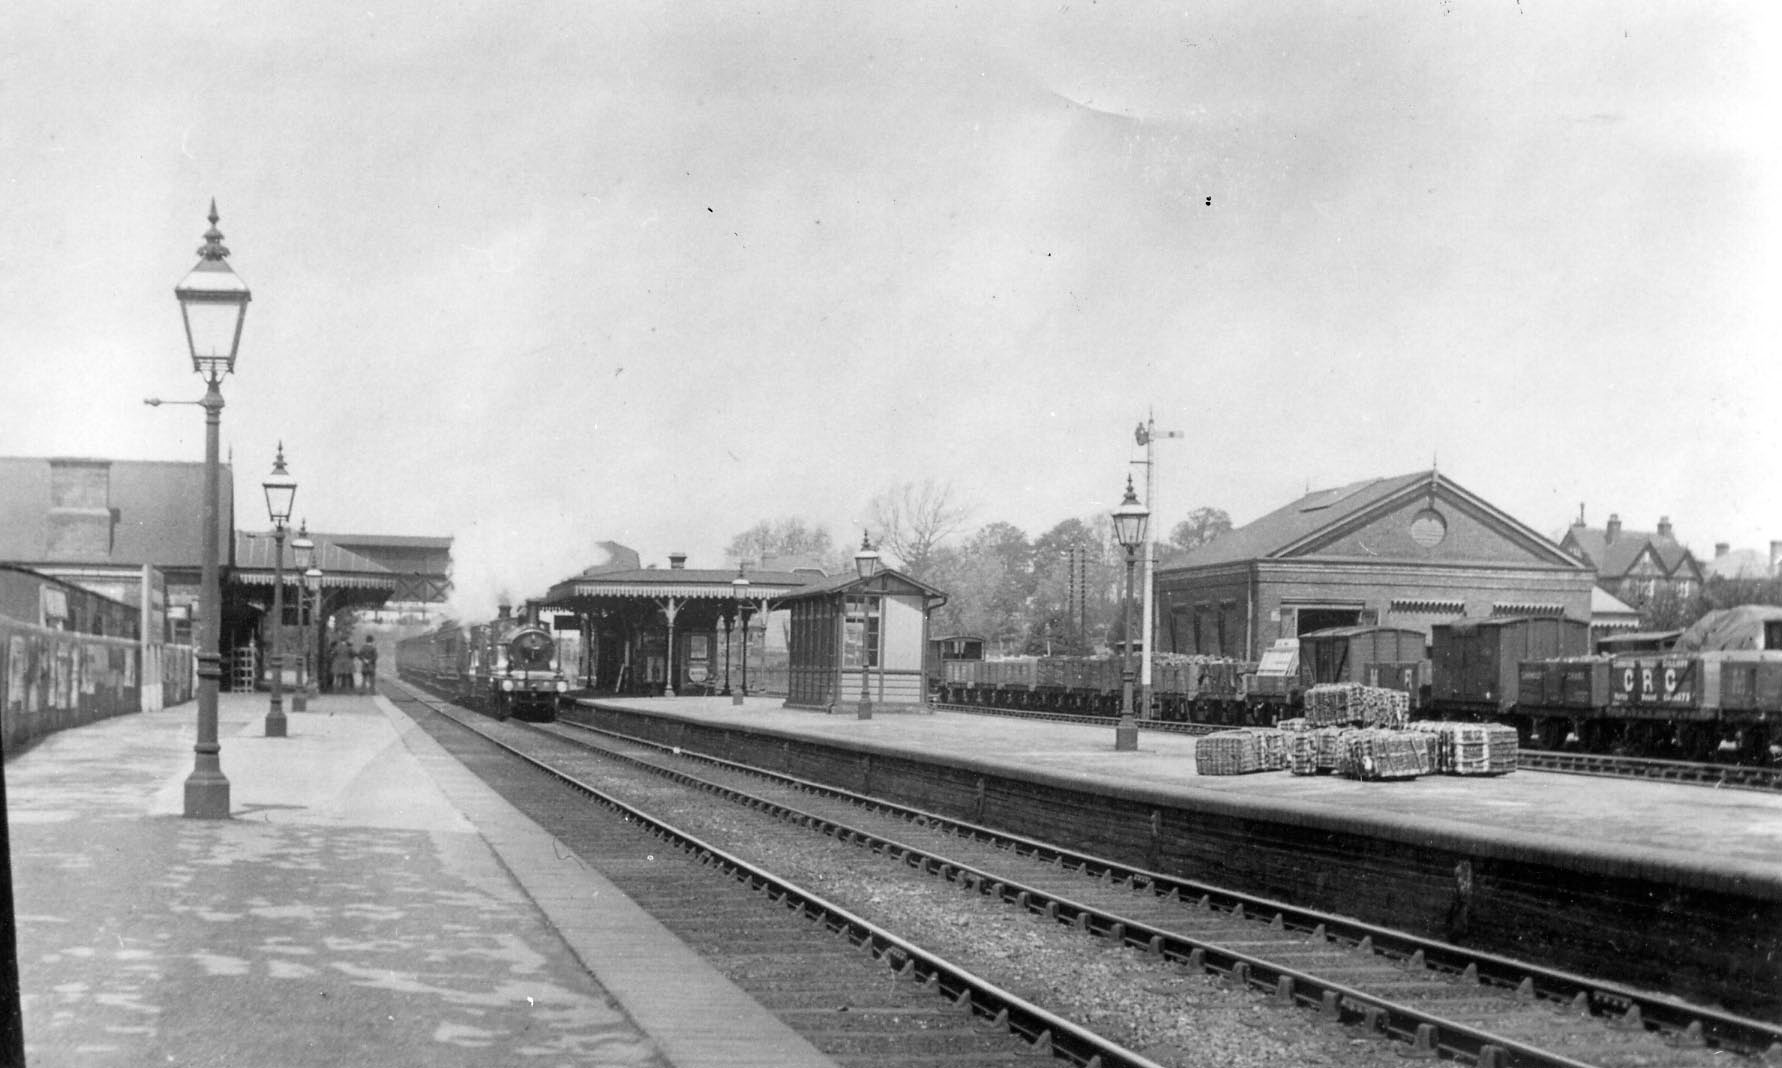
In 1860 the Great Northern Railway branch line from Hatfield reached Harpenden and in 1868 the Midland main line to St Pancras was opened. When two large farm estates were sold in the early 1880’s, land was available for development. The first estate to be sold was known as Park View, and on it were built Milton, Shakespeare and Spenser Roads. Next came Church Farm Estate, to the west of the Parish Church, and on this was built the area known collectively as “The Avenues” – Salisbury, Rosebery, Kirkwick. etc.
Growth continued, relatively slowly, until the first world war, with a total increase of 84 houses between 1881 and 1891; 271 houses between 1891 and 1901; and 268 between 1901 and 1911. Some new roads built or started, were Clarence Road, Wordsworth Road and Tennyson Road, and a group off Ox Lane – Jameson, St James, Lea and Willoughby Roads.
At this point it is, perhaps, worth remembering that not all the houses which are at present in a road were necessarily built at the same time. It often happens that a road is started with only a few houses, and more are built later, sometimes with several years interval. It is worth looking at the houses in a particular road to see if styles have changed.
There were only 113 more houses in 1921 than in 1911, but the next two decades were a time of great expansion. By 1931 the population had grown by 2886 since 1921, and the number of houses had increased by 1095. Thus in 1931 there were 9624 people and 2574 houses, giving a ratio of 3.7 people to a house. Because of the war no census was taken in 1941, so exact figures are not available. But Harpenden’s population in 1939 was estimated to be 13,000, so assuming the same ratio, there would be 3,514 houses, an increase of 940 houses during the 8 years.
This growth took place mainly between the High Street and lower Luton Road, and spreading out along the main road, to Luton. Some roads built were Stewart Road, Sauncey Avenue, Crossway, West Way and Manland Avenue; Overstone Road, Dalkeith Road, and a group centred on Lyndhurst Drive – Carisbrooke Road, Langdale, Granby and Grassmere Avenues.
Another area of development was on both sides of the Luton Road just north of the railway bridge; Park Hill, Park Rise, Roundwood Park, Roundwood Lane, Woodend Road, on the west side, and Bloomfield Road, Hillside Road and Ambrose Lane on the east.
In south-east Harpenden were Meadow Walk, Barnfield Road, Rowan Way and Birch Way; Topstreet Way, Fairmead and Highfield Avenues.
Development stopped during the second world war, but a great deal of planning for the future took place. In 1951 Hertfordshire County Council published a general development plan for the county, and also plans for the individual towns.
Harpenden’s town plan listed four areas as suitable for future housing:
- The Wood End area, for 415 houses; it is now Tuffnells Way, Yeomans Avenue etc. These were built during the late fifties and early sixties.
- Batford, for 560 houses; now Porters Hill, Pickford Hill, and roads off, built during the early fifties.
- The Grove area, for 400 houses; now Pipers Avenue, Sibley Avenue, Meadway etc, built during the late fifties and early sixties
- West Common/ Beesonend area, for 180 houses; built during the late sixties.
Between 1961 and 1971 the towns population increased by 32%, and the total number of houses from 5,966 to 7,964. To find space for all these new houses becomes a problem, and in an attempt to solve it, a lot of in-filling has taken place.
The easiest method of development is that known as ribbon development, where houses are built along existing roads, with services such as drainage, water, gas and electricity easily available. During the nineteen thirties, when planning controls were much less strict than they are today, a lot of this form of development was carried out, resulting in long fingers of growth along the main roads, with undeveloped fields and patches of ground behind them.
When land suitable for building becomes scarce, these undeveloped areas have to be used, provided access to a road can be obtained. This is usually done by taking a road across a bigger than usual garden, or occasionally by pulling down an existing house to make room for a road. Using these odd patches of land is known as in-filling. Examples can be seen at Lambourn Gardens, off Ambrose Lane, and at Waveney Road which has been built on the site of the old Harpenden East Station.
Other building areas during approximately the last ten years are:-
- Aldwickbury Crescent, off Crabtree Lane, with Tylers, Altwood, Waldegrave Park and Ashwells Park.
- Behind Kinsbourne Green ; Derwent Road, Kinsbourne Close and Tintern Close.
- Eastmoor Park on the Common.
- Broadstone Road and roads off it, between Cross Lane, Coleswood Road and the railway in South Harpenden.
- Falconers Field off Roundwood Park.
Social conditions are, of course, constantly changing. Nowadays people do not normally have the large families of Victorian times, and do not, generally, have a number of servants living in, so very large houses are less in demand than they once were. A large part of Milton Road, which was built in the 1880’s, has now been pulled down, and blocks of flats have been built in their place; this allows many more people to live in the same amount of space.
Similarly single old houses, with large gardens, are pulled down and several houses or flats built instead. One example is Old Rectory Close, next to what was the Embassy Cinema (now a filling station), which stands on the site of the original Harpenden Rectory and its garden.
Another fairly recent development is the practice of extending existing houses. When money is expensive to borrow, it becomes difficult to buy and sell houses, so people who need a larger house sometimes extend their present one. This is usually done by adding rooms at the back, into the garden, or by adding to the side; sometimes a room is built above the garage, and lofts are often converted, to add one or two rooms. There are examples of extensions all over Harpenden; one is opposite the entrance to Roundwood School.
In April 1973 there were 8,351 houses in Harpenden; the area of the town was 3,157 acres, and the population was 24,550 people. There was then, therefore, an average of 2.9 people to each house, and of 2.6 houses to each acre.
Harpenden Housing Statistics (Official Census Figures)
Date Inhabited houses Population
- 1801 225 1112
- 1811 291 1386
- 1821 307 1693
- 1831 357 1972
- 1841 389 1872
- 1851 418 1980
- 1861 455 2164
- 1871 556 2608
- 1881 643 3064
- 1891 827 3916
- 1901 1098 5067
- 1911 1366 6172
- 1921 1479 6738
- 1931 2574 9624
- 1941 No census
- 1951 4430 14244
- 1961 5966 18307
Date Houses at 1st April Population at 30th June
- 1966 6859 21390
- 1967 7169 22020
- 1968 7325 22580
- 1969 7605 23000
- 1970 7813 23350
- 1971 7964 24390
- 1972 8143 24550
- 1973 8351 –
No Comments
Add a comment about this page